Title: PySmithPlot/Polar Plot update broken in 2.1.2 (works in 2.0.2) · Issue #10654 · matplotlib/matplotlib · GitHub
Open Graph Title: PySmithPlot/Polar Plot update broken in 2.1.2 (works in 2.0.2) · Issue #10654 · matplotlib/matplotlib
X Title: PySmithPlot/Polar Plot update broken in 2.1.2 (works in 2.0.2) · Issue #10654 · matplotlib/matplotlib
Description: Bug report Bug summary The smith chart grid is distorted in 2.1.2, correct in 2.0.2. Updating the polar plot data blanks the plot in 2.1.2, updates properly in 2.0.2. In both versions when I create the plots/lines I see: /Users/chrisgmor...
Open Graph Description: Bug report Bug summary The smith chart grid is distorted in 2.1.2, correct in 2.0.2. Updating the polar plot data blanks the plot in 2.1.2, updates properly in 2.0.2. In both versions when I create...
X Description: Bug report Bug summary The smith chart grid is distorted in 2.1.2, correct in 2.0.2. Updating the polar plot data blanks the plot in 2.1.2, updates properly in 2.0.2. In both versions when I create...
Opengraph URL: https://github.com/matplotlib/matplotlib/issues/10654
X: @github
Domain: github.com
{"@context":"https://schema.org","@type":"DiscussionForumPosting","headline":"PySmithPlot/Polar Plot update broken in 2.1.2 (works in 2.0.2) ","articleBody":"\u003c!--To help us understand and resolve your issue, please fill out the form to the best of your ability.--\u003e\r\n\u003c!--You can feel free to delete the sections that do not apply.--\u003e\r\n\r\n### Bug report\r\n\r\n**Bug summary**\r\n\r\nThe smith chart grid is distorted in 2.1.2, correct in 2.0.2.\r\nUpdating the polar plot data blanks the plot in 2.1.2, updates properly in 2.0.2.\r\n\r\nIn both versions when I create the plots/lines I see:\r\n\r\n/Users/chrisgmorton/usr/tcad/fusion/prod/lib/python3.6/site-packages/pysmithplot-0.2.0-py3.6.egg/smithplot/smithhelper.py:46: RuntimeWarning: divide by zero encountered in true_divide\r\n/Users/chrisgmorton/usr/tcad/fusion/prod/lib/python3.6/site-packages/pysmithplot-0.2.0-py3.6.egg/smithplot/smithhelper.py:46: RuntimeWarning: invalid value encountered in true_divide\r\n/Users/chrisgmorton/usr/tcad/fusion/prod/lib/python3.6/site-packages/matplotlib/projections/polar.py:58: RuntimeWarning: invalid value encountered in less\r\n mask = r \u003c 0\r\n\r\nOn the first update of the plots I see:\r\n\r\nUsers/chrisgmorton/usr/tcad/fusion/prod/lib/python3.6/site-packages/matplotlib/projections/polar.py:58: RuntimeWarning: invalid value encountered in less\r\n mask = r \u003c 0\r\n\r\nand the polar plots are then blanked out (not so with 2.0.2).\r\n\r\n**Code for reproduction**\r\n\r\n\u003c!--A minimum code snippet required to reproduce the bug, also minimizing the number of dependencies required--\u003e\r\nPlots are built with:\r\n```python\r\n self.axes=[]\r\n n = self.numberOfPorts\r\n \r\n for i,j in self.indices:\r\n if i==j: self.axes.append(self.fig.add_subplot(n,n,1+i*2+j, projection='smith'))\r\n else: self.axes.append(self.fig.add_subplot(n,n,1+i*2+j, projection='polar'))\r\n\r\n for k,(i,j) in enumerate(self.indices):\r\n self.axes[k].tick_params(which='major', labelsize=10)\r\n\r\n self.fig.subplots_adjust(top=0.9)\r\n```\r\nLines initialized with:\r\n```python\r\n self.lines=[]\r\n \r\n for m,(i,j) in enumerate(self.indices):\r\n\r\n if i==j: # Smith Chart\r\n S=self.Splt.T[j,i].T\r\n Z = (1+S)/(1-S) # normalized impedance on Smith Chart\r\n\r\n self.lines.append(self.axes[m].plot(Z.T, color='b', marker='', markerfacecolor='b', markeredgecolor='b'))\r\n else: # Polar Plot\r\n S = self.Splt.T[j,i].T\r\n self.lines.append(self.axes[m].plot(np.angle(S.T), np.absolute(S.T), color='r', marker='', markerfacecolor='r', markeredgecolor='r'))\r\n```\r\n\r\nLines updated with:\r\n```python\r\n for k,(i,j) in enumerate(self.indices):\r\n \r\n if i==j: # Smith Chart\r\n S=self.Splt.T[j,i].T\r\n Z = (1+S)/(1-S) # normalized impedance on Smith Chart\r\n\r\n [line.set_xdata(np.real(Z[idx])) for idx, line in enumerate(self.lines[k])]\r\n [line.set_ydata(np.imag(Z[idx])) for idx, line in enumerate(self.lines[k])]\r\n \r\n else: # Polar Plot\r\n S = self.Splt.T[j,i].T\r\n\r\n [line.set_xdata(np.angle(S[idx])) for idx, line in enumerate(self.lines[k])]\r\n [line.set_ydata(np.absolute(S[idx])) for idx, line in enumerate(self.lines[k])]\r\n```\r\n**Actual outcome**\r\n\r\n\u003c!--The output produced by the above code, which may be a screenshot, console output, etc.--\u003e\r\nMatplotlib 2.1.2 output, on completion of simulation:\r\n\r\n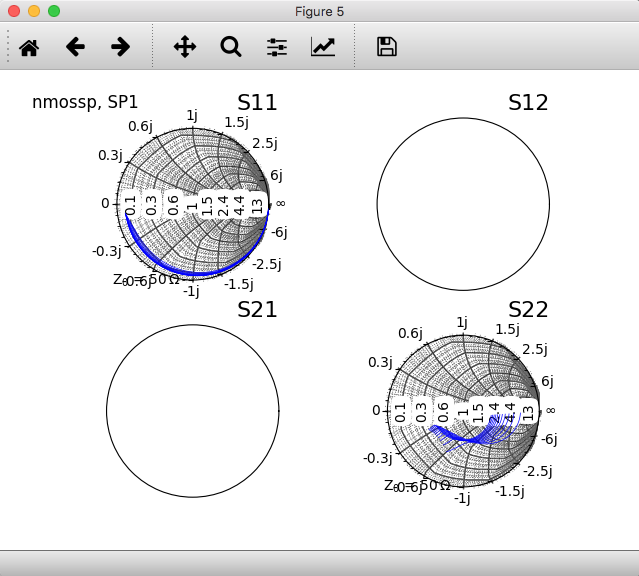\r\n\r\n**Expected outcome**\r\n\r\n\u003c!--A description of the expected outcome from the code snippet--\u003e\r\n\u003c!--If this used to work in an earlier version of Matplotlib, please note the version it used to work on--\u003e\r\nMatplotlib 2.0.2 output, on completion of simulation:\r\n\r\n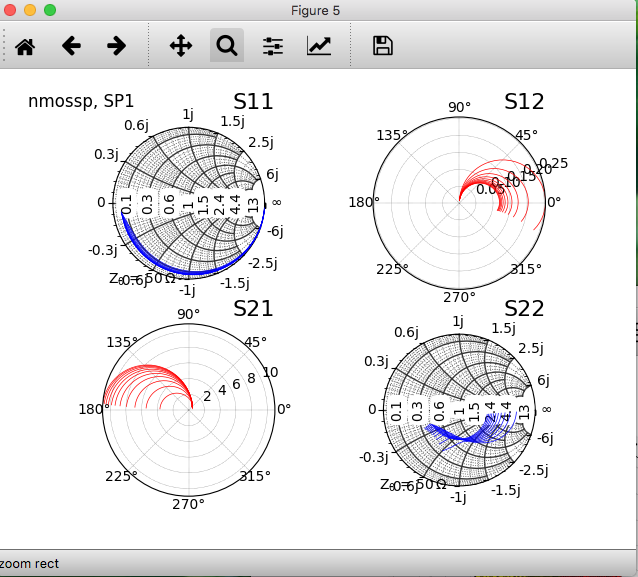\r\n\r\n**Matplotlib version**\r\n\u003c!--Please specify your platform and versions of the relevant libraries you are using:--\u003e\r\n * Operating system: Ubuntu 16.04 and OSX 10.13.3\r\n * Matplotlib version: 2.1.2\r\n * Matplotlib backend: Qt5Agg (Qt5.10)\r\n * Python version: 3.6.4\r\n * PySmithPlot version: 0.2\r\n\r\n\u003c!--Please tell us how you installed matplotlib and python e.g., from source, pip, conda--\u003e\r\nMatplotlib installed using pip. Qt5 and PyQt5 built from source. Python 3.6.4 built from source.\r\n\u003c!--If you installed from conda, please specify which channel you used if not the default--\u003e","author":{"url":"https://github.com/chrisgmorton","@type":"Person","name":"chrisgmorton"},"datePublished":"2018-03-03T01:31:01.000Z","interactionStatistic":{"@type":"InteractionCounter","interactionType":"https://schema.org/CommentAction","userInteractionCount":31},"url":"https://github.com/10654/matplotlib/issues/10654"}| route-pattern | /_view_fragments/issues/show/:user_id/:repository/:id/issue_layout(.:format) |
| route-controller | voltron_issues_fragments |
| route-action | issue_layout |
| fetch-nonce | v2:107605ff-5198-2e44-da0f-e9231abecdc1 |
| current-catalog-service-hash | 81bb79d38c15960b92d99bca9288a9108c7a47b18f2423d0f6438c5b7bcd2114 |
| request-id | B062:1BA1D0:2CE6A6:3AE21A:6A52F57D |
| html-safe-nonce | bc091e1c4995240ae52c56a72f8ebe63f3889ab0bcf0298ed56f107606012fe2 |
| visitor-payload | eyJyZWZlcnJlciI6IiIsInJlcXVlc3RfaWQiOiJCMDYyOjFCQTFEMDoyQ0U2QTY6M0FFMjFBOjZBNTJGNTdEIiwidmlzaXRvcl9pZCI6IjI1MjMzODQwOTk4NDY4NTQzNyIsInJlZ2lvbl9lZGdlIjoiaWFkIiwicmVnaW9uX3JlbmRlciI6ImlhZCJ9 |
| visitor-hmac | e18d9f41a697928d713c8f9f73e5ff891a7b307ec6d3e77ef92ce017c7f37823 |
| hovercard-subject-tag | issue:301954714 |
| github-keyboard-shortcuts | repository,issues,copilot |
| google-site-verification | Apib7-x98H0j5cPqHWwSMm6dNU4GmODRoqxLiDzdx9I |
| octolytics-url | https://collector.github.com/github/collect |
| analytics-location | / |
| fb:app_id | 1401488693436528 |
| apple-itunes-app | app-id=1477376905, app-argument=https://github.com/_view_fragments/issues/show/matplotlib/matplotlib/10654/issue_layout |
| twitter:image | https://opengraph.githubassets.com/c137f7b0c173ffd0369c95fb844d762a9e4b47566530f120defd6811c7610c4f/matplotlib/matplotlib/issues/10654 |
| twitter:card | summary_large_image |
| og:image | https://opengraph.githubassets.com/c137f7b0c173ffd0369c95fb844d762a9e4b47566530f120defd6811c7610c4f/matplotlib/matplotlib/issues/10654 |
| og:image:alt | Bug report Bug summary The smith chart grid is distorted in 2.1.2, correct in 2.0.2. Updating the polar plot data blanks the plot in 2.1.2, updates properly in 2.0.2. In both versions when I create... |
| og:image:width | 1200 |
| og:image:height | 600 |
| og:site_name | GitHub |
| og:type | object |
| og:author:username | chrisgmorton |
| hostname | github.com |
| expected-hostname | github.com |
| None | b9a586c06a05a7a86fc7e3f4dbd03e42f6869085879aa184aa6369456dbd50fb |
| turbo-cache-control | no-preview |
| go-import | github.com/matplotlib/matplotlib git https://github.com/matplotlib/matplotlib.git |
| octolytics-dimension-user_id | 215947 |
| octolytics-dimension-user_login | matplotlib |
| octolytics-dimension-repository_id | 1385122 |
| octolytics-dimension-repository_nwo | matplotlib/matplotlib |
| octolytics-dimension-repository_public | true |
| octolytics-dimension-repository_is_fork | false |
| octolytics-dimension-repository_network_root_id | 1385122 |
| octolytics-dimension-repository_network_root_nwo | matplotlib/matplotlib |
| turbo-body-classes | logged-out env-production page-responsive |
| disable-turbo | false |
| browser-stats-url | https://api.github.com/_private/browser/stats |
| browser-errors-url | https://api.github.com/_private/browser/errors |
| release | 07a982c1d40157c619b364352b704c3ce66bb332 |
| ui-target | canary-1 |
| theme-color | #1e2327 |
| color-scheme | light dark |
Links:
Viewport: width=device-width

