Title: imshow doesn't properly display some images · Issue #10072 · matplotlib/matplotlib · GitHub
Open Graph Title: imshow doesn't properly display some images · Issue #10072 · matplotlib/matplotlib
X Title: imshow doesn't properly display some images · Issue #10072 · matplotlib/matplotlib
Description: Bug report Bug summary When using imshow with larger images, you lose pixel resolution for low intensity pixels with lots of nearby zeros (not sure if the intensity or nearby zeros are relevant, or just relative isolation of the pixel). ...
Open Graph Description: Bug report Bug summary When using imshow with larger images, you lose pixel resolution for low intensity pixels with lots of nearby zeros (not sure if the intensity or nearby zeros are relevant, or...
X Description: Bug report Bug summary When using imshow with larger images, you lose pixel resolution for low intensity pixels with lots of nearby zeros (not sure if the intensity or nearby zeros are relevant, or...
Opengraph URL: https://github.com/matplotlib/matplotlib/issues/10072
X: @github
Domain: github.com
{"@context":"https://schema.org","@type":"DiscussionForumPosting","headline":"imshow doesn't properly display some images","articleBody":"### Bug report\r\n\r\n**Bug summary**\r\nWhen using imshow with larger images, you lose pixel resolution for low intensity pixels with lots of nearby zeros (not sure if the intensity or nearby zeros are relevant, or just relative isolation of the pixel). It's like they're being interpolated away, even if interpolation is set to nearest. This is new behavior in version 2.1.\r\n\r\n**Code for reproduction**\r\nUse the attached npy file, which is an image referenced in this test script.\r\n```python\r\nimport matplotlib.pyplot as plt\r\nimport numpy as np\r\n\r\nimg = np.load('test_image.npy')\r\n\r\n#Display full image\r\nplt.imshow(img, interpolation = 'nearest')\r\nplt.clim(0, 5)\r\nplt.show()\r\n\r\n#Display part of image\r\nplt.imshow(img[200:400,500:700], interpolation = 'nearest')\r\nplt.clim(0, 5)\r\nplt.show()\r\n```\r\n\r\n**Actual outcome**\r\nUsing matplotlib 2.1.1:\r\nScreenshot from the display of full image (first plot in code above):\r\n\r\n\r\nUsing the zoom tool to zoom in on a region when the full image is plotted:\r\n\r\n\r\nPlotting roughly the same zoom region initially (second plot in code above):\r\n\r\n\r\n\r\n**Expected outcome**\r\nIt should all look like the third image. Here's the output when the same code is run in version 2.0.2\r\nScreenshot from the display of full image (first plot in code above):\r\n\r\n\r\nUsing the zoom tool to zoom in on a region when the full image is plotted:\r\n\r\n\r\nPlotting roughly the same zoom region initially (second plot in code above):\r\n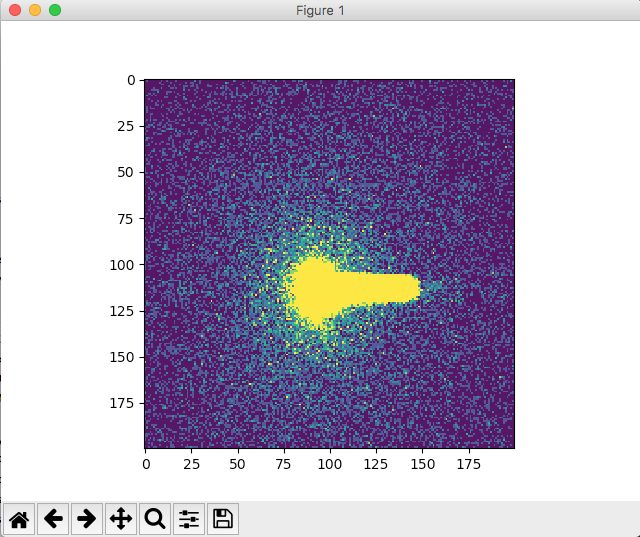\r\n\r\n\r\n**Matplotlib version**\r\n * Operating system: macOS 10.12.6\r\n * Matplotlib version: 2.1.1 (broken) and 2.0.2 (working)\r\n * Matplotlib backend (`print(matplotlib.get_backend())`): MacOSX\r\n * Python version: 2.7.12\r\n * Other libraries: numpy version 1.13.3\r\n\r\nAll libraries are installed through conda, using the standard channel. This includes both versions of matplotlib (2.1.1 and 2.0.2).\r\n\r\nNumpy file with image data:\r\n[test_image.zip](https://github.com/matplotlib/matplotlib/files/1579886/test_image.zip)\r\n","author":{"url":"https://github.com/jbhopkins","@type":"Person","name":"jbhopkins"},"datePublished":"2017-12-21T16:59:34.000Z","interactionStatistic":{"@type":"InteractionCounter","interactionType":"https://schema.org/CommentAction","userInteractionCount":30},"url":"https://github.com/10072/matplotlib/issues/10072"}| route-pattern | /_view_fragments/issues/show/:user_id/:repository/:id/issue_layout(.:format) |
| route-controller | voltron_issues_fragments |
| route-action | issue_layout |
| fetch-nonce | v2:17d4fcc1-3d46-e5e5-10d9-4b2f15d7bb3d |
| current-catalog-service-hash | 81bb79d38c15960b92d99bca9288a9108c7a47b18f2423d0f6438c5b7bcd2114 |
| request-id | 8144:372744:11437DB:178CDF0:6A5212ED |
| html-safe-nonce | 5503b77e07dd5349366c5d01a80b545981abedb4aec1afc5b6915fcb0ce3c906 |
| visitor-payload | eyJyZWZlcnJlciI6IiIsInJlcXVlc3RfaWQiOiI4MTQ0OjM3Mjc0NDoxMTQzN0RCOjE3OENERjA6NkE1MjEyRUQiLCJ2aXNpdG9yX2lkIjoiMTMwNzEwNTc4NTczMDQzNzg2OSIsInJlZ2lvbl9lZGdlIjoiaWFkIiwicmVnaW9uX3JlbmRlciI6ImlhZCJ9 |
| visitor-hmac | 4e4dec49b8e67d17583dfd5e09e89fc93bca9b37bb852afb15b12fe6c968d2cb |
| hovercard-subject-tag | issue:283944054 |
| github-keyboard-shortcuts | repository,issues,copilot |
| google-site-verification | Apib7-x98H0j5cPqHWwSMm6dNU4GmODRoqxLiDzdx9I |
| octolytics-url | https://collector.github.com/github/collect |
| analytics-location | / |
| fb:app_id | 1401488693436528 |
| apple-itunes-app | app-id=1477376905, app-argument=https://github.com/_view_fragments/issues/show/matplotlib/matplotlib/10072/issue_layout |
| twitter:image | https://opengraph.githubassets.com/2113dc9664afc3ffdc76175b3e423c8d864c3a9dc42aa8bfec70c57ff069365b/matplotlib/matplotlib/issues/10072 |
| twitter:card | summary_large_image |
| og:image | https://opengraph.githubassets.com/2113dc9664afc3ffdc76175b3e423c8d864c3a9dc42aa8bfec70c57ff069365b/matplotlib/matplotlib/issues/10072 |
| og:image:alt | Bug report Bug summary When using imshow with larger images, you lose pixel resolution for low intensity pixels with lots of nearby zeros (not sure if the intensity or nearby zeros are relevant, or... |
| og:image:width | 1200 |
| og:image:height | 600 |
| og:site_name | GitHub |
| og:type | object |
| og:author:username | jbhopkins |
| hostname | github.com |
| expected-hostname | github.com |
| None | b9a586c06a05a7a86fc7e3f4dbd03e42f6869085879aa184aa6369456dbd50fb |
| turbo-cache-control | no-preview |
| go-import | github.com/matplotlib/matplotlib git https://github.com/matplotlib/matplotlib.git |
| octolytics-dimension-user_id | 215947 |
| octolytics-dimension-user_login | matplotlib |
| octolytics-dimension-repository_id | 1385122 |
| octolytics-dimension-repository_nwo | matplotlib/matplotlib |
| octolytics-dimension-repository_public | true |
| octolytics-dimension-repository_is_fork | false |
| octolytics-dimension-repository_network_root_id | 1385122 |
| octolytics-dimension-repository_network_root_nwo | matplotlib/matplotlib |
| turbo-body-classes | logged-out env-production page-responsive |
| disable-turbo | false |
| browser-stats-url | https://api.github.com/_private/browser/stats |
| browser-errors-url | https://api.github.com/_private/browser/errors |
| release | 7aed05249554b889eb33d002851a973eebcc7e91 |
| ui-target | full |
| theme-color | #1e2327 |
| color-scheme | light dark |
Links:
Viewport: width=device-width


